The Reporting button at the very top of your screen, between Dashboard and Planner, allows you to report on much more information about multiple students.
Overview
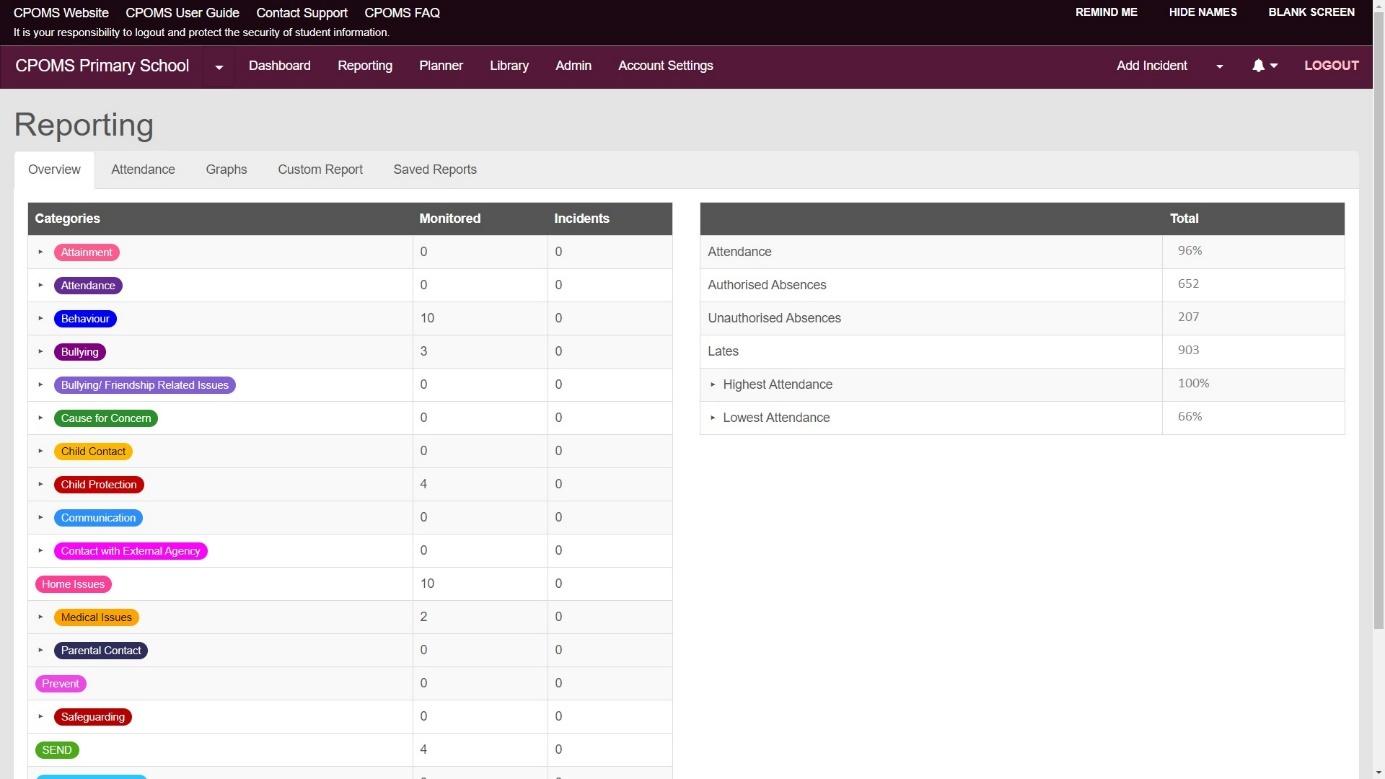
The first tab of reporting presents you with an overview of your CPOMS, listing the total number of current monitored students and the total number of incidents logged in the system and under which categories during the current academic year.
To the right you will find your whole school attendance figures, as well as your highest and lowest attendees at the click of a button.
Attendance
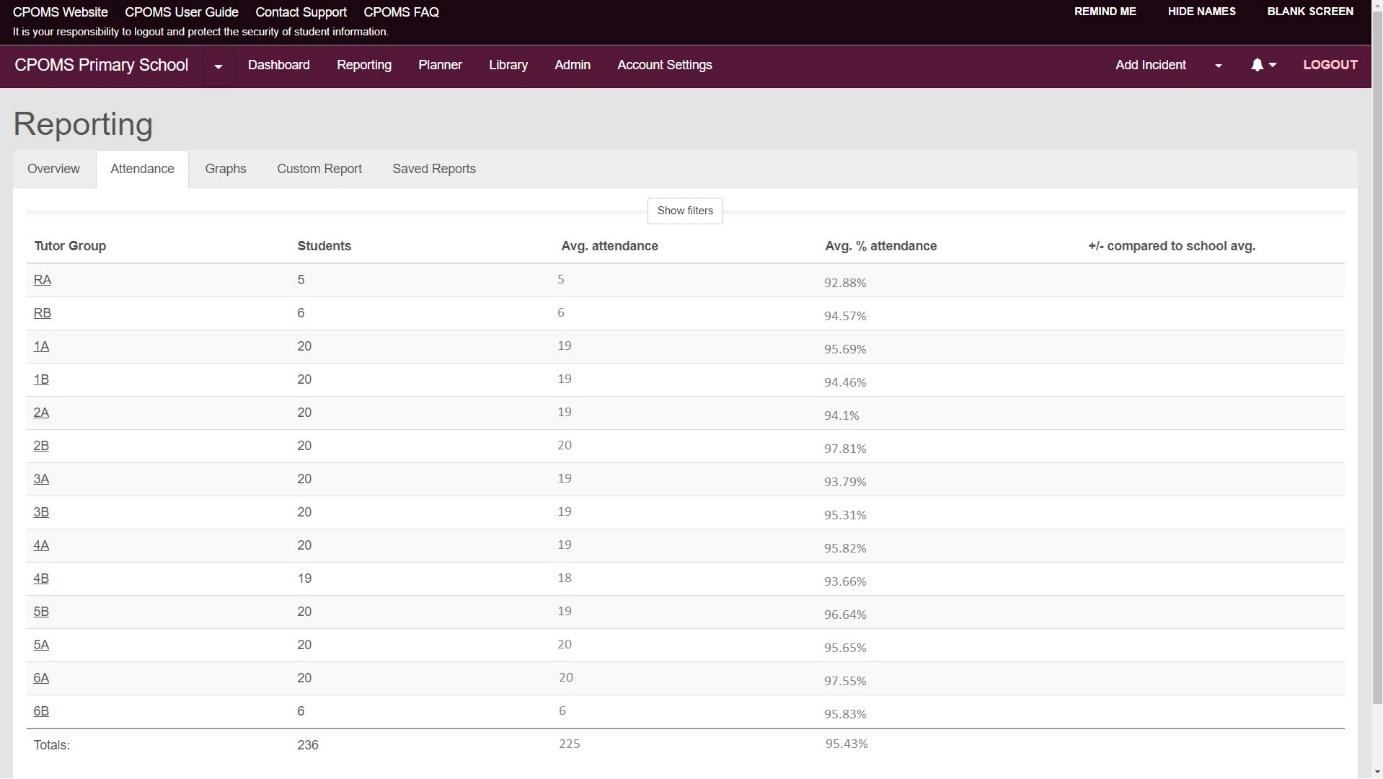
The second tab along is the Attendance tab. This will break down your school attendance by class and show you how each different class attendance compares to the school average.
You can also click into a particular class to see a breakdown of attendance per student, sorted highest to lowest.
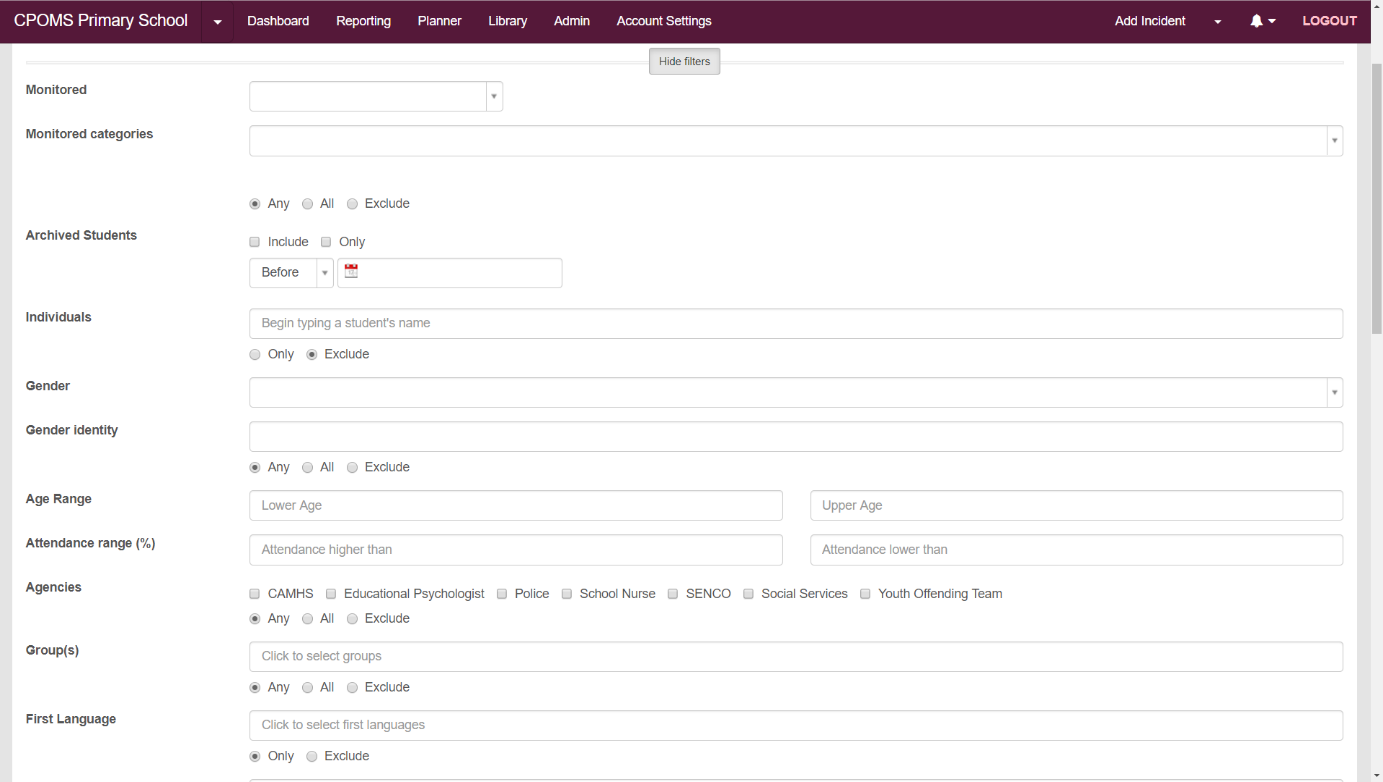
You may also choose to filter your attendance by many parameters by selecting the ‘Show Filters’ option (above the attendance table).
Using the filters, you may look at your ‘Monitored’ students’ attendance only – Now, Ever, or between a certain timeframe, or the attendance of those who are monitored for a particular category, e.g. your Child Protection children only. Further filters include Pupil Premium, Religion, Age Range, SEN Status, Ethnicity, Gender, Year Group and many more.
This allows you to change certain aspects of your attendance to see how they impact upon current levels of attendance.
Graphs
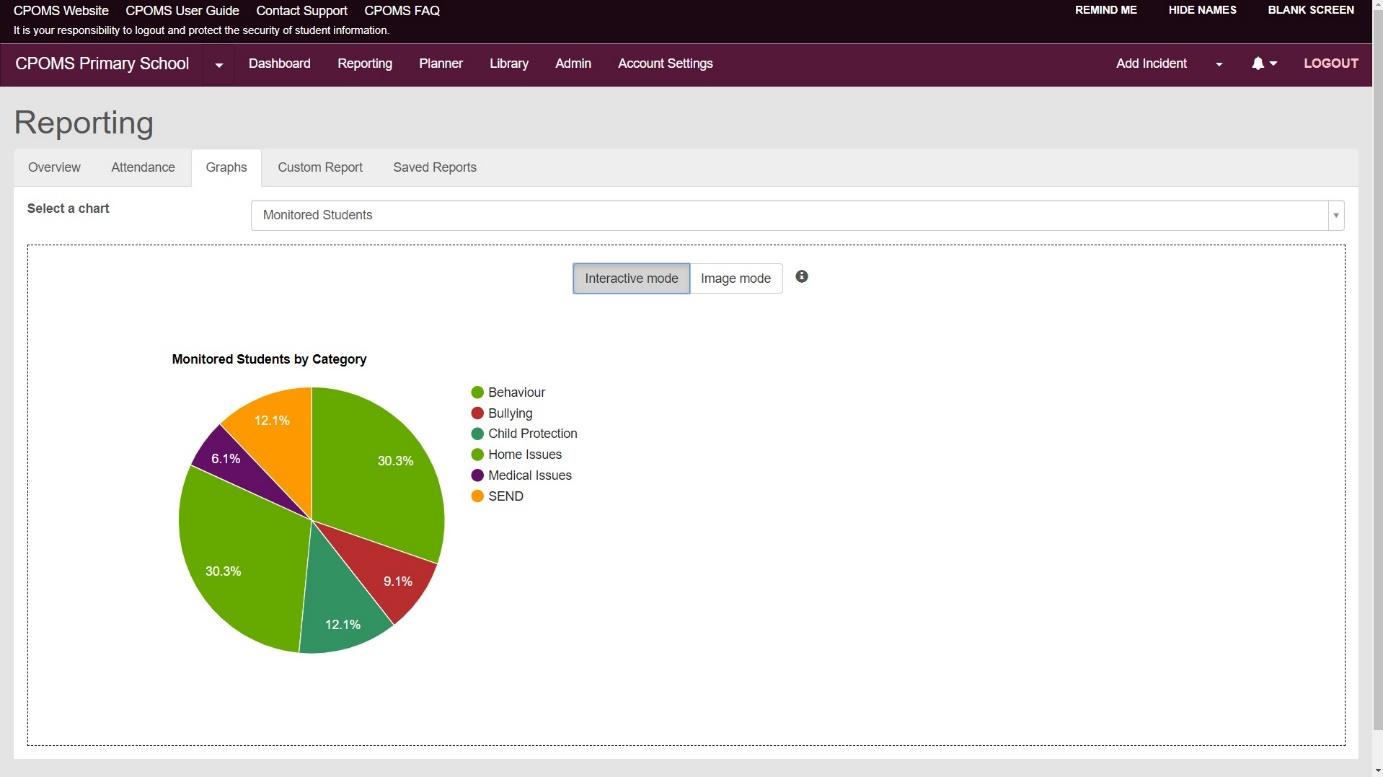
The next tab in the Reporting section is Graphs. These are several different managerial graphs which you can look at and export to give you a more visual overview of information held in CPOMS.
The current graph capabilities are:-
-
- Absences by Class
-
- Incidents by Category
-
- Incidents by Month
-
- Monitored Students
-
- SEN Status
-
- Student Ethnicity
-
- Student Religion
-
- Unauthorised Absences
-
- Absence by Class Graph
Interactive mode allows you to hover over the chart to see specific values. Image mode allows you to save or copy the graph into another program by dragging it or right-clicking the image and ‘save image as’.
These graphs are only some of what we can do, if you can think of any more that may be useful to you please do not hesitate to let us know.
You may also create your own Graphs and Charts within the Custom Report section next.
Custom Report
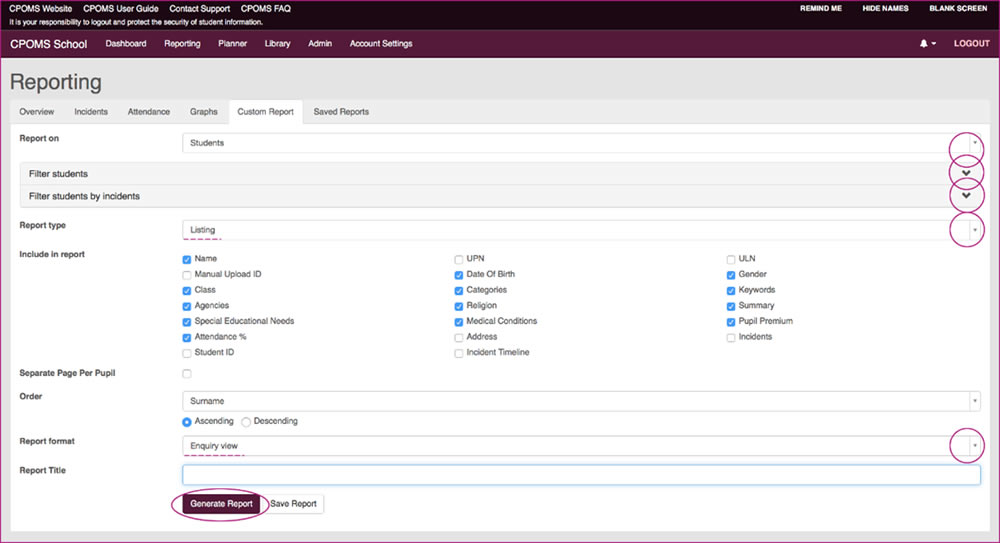
The Custom Report tab combines much of the tabs we have seen before all in the one place.
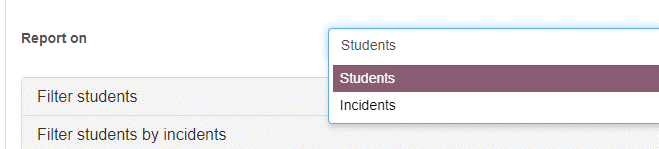
Firstly you can choose what to report on at the top, ‘Students’ or ‘Incidents’.
The ‘Filter students’ and ‘Filter incidents’ options can then be used to narrow down the results of the report so that you can drill down into specific areas that you are interested in, e.g. by Pupil Premium, Religion, Age Range, SEN Status, Ethnicity, Gender, Year Group and many more.

Under ‘Report type’ you can then choose how you would like your results to be displayed:-
-
- Listing – Lists the results in detail individually.
-
- Summary table – Creates a numerical table displaying the number of results in each group as specified by your selected ‘Primary Grouping’ and ‘Secondary Grouping’ option if you choose one.
-
- Summary chart – Similar to the summary table, but in a chart format. You can choose the type of chart once this option is selected, including Pie, Column and Bar.
-
- Combined graph – A chart that combines two groupings on the same graph.
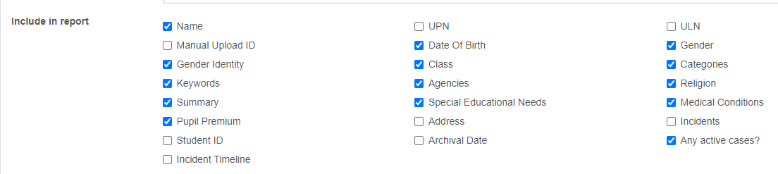
When ‘Listing’ is selected for a Students’ report, you can choose what you would like to include about each student by ticking/ un-ticking the ‘Include in report’ checkboxes.
When you tick to include ‘Incidents,’ here, you will receive extra options to only display particular kinds of incident. As with all the reporting options, if you select nothing at all, everything will be returned.
The summary report types are numerical and require you to group the results by some property so that they can be counted. If you choose two groupings, you will get multiple tables of results.
You may also save a report for future use, simply enter a ‘Report Title’ which will then save the report to your ‘Saved Reports’ tab.
Following feedback from our schools, this reporting tab has been designed to give you much more flexibility to manipulate the data stored in CPOMS for various purposes. For example, you may wish to know how many behaviour incidents each tutor group has had in a term, or look at pupil premium v attendance.
Q: How do I add our school logo to reports? To add your school logo to appear in the header of PDF reports, firstly upload the school logo into your CPOMS ‘Library’ area, in your preferred size. Next, navigate to your CPOMS ‘Admin’ area, selecting the ‘Settings’ tab. Scroll down to the ‘School Logo’, select the relevant logo here and click ‘Update Settings’